
Data at Your Fingertips
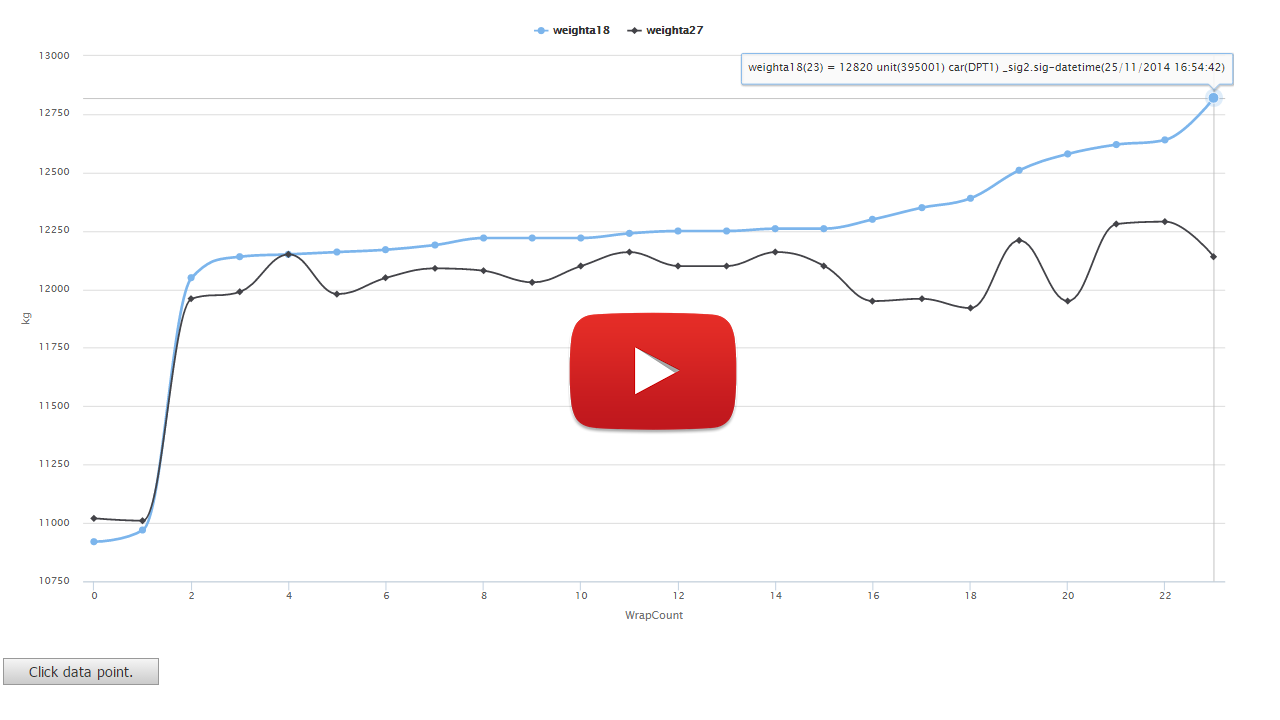
At ExcelWraps we create Wraps from Excel worksheets. Using the cell names defined in our spreadsheet we pick off particular items to generate a MyWraps report like this. The cell names I used are here the railway ‘unit' number, the ‘car' type, an axle weights named ‘weighta18' and ‘weighta27'. We even pick out the time and date the weighing was completed. We have 72 wrap instances in total across 4 pages for axle weights of many cars in the fleet. The table is easily sorted and filtered to examine the results but the best way to view all the instances is in a chart – we have one simple button to switch from table view to chart view. The chart view gives us a good overview of the data and hovering each data point we see the source of the information. We can click any data point to get a link back to the wrap instance that provided this data. It is highlighted in yellow in the Wrap instance. All the sorting and filtering controls work in chart view too so it’s easy to find the leading axle weights of driver cars and order them from lowest to highest. Now let’s show this as a column chart. ExcelWraps really does give you data at your fingertips and all you need to know is Excel.